
Overview
Every service, one screen.
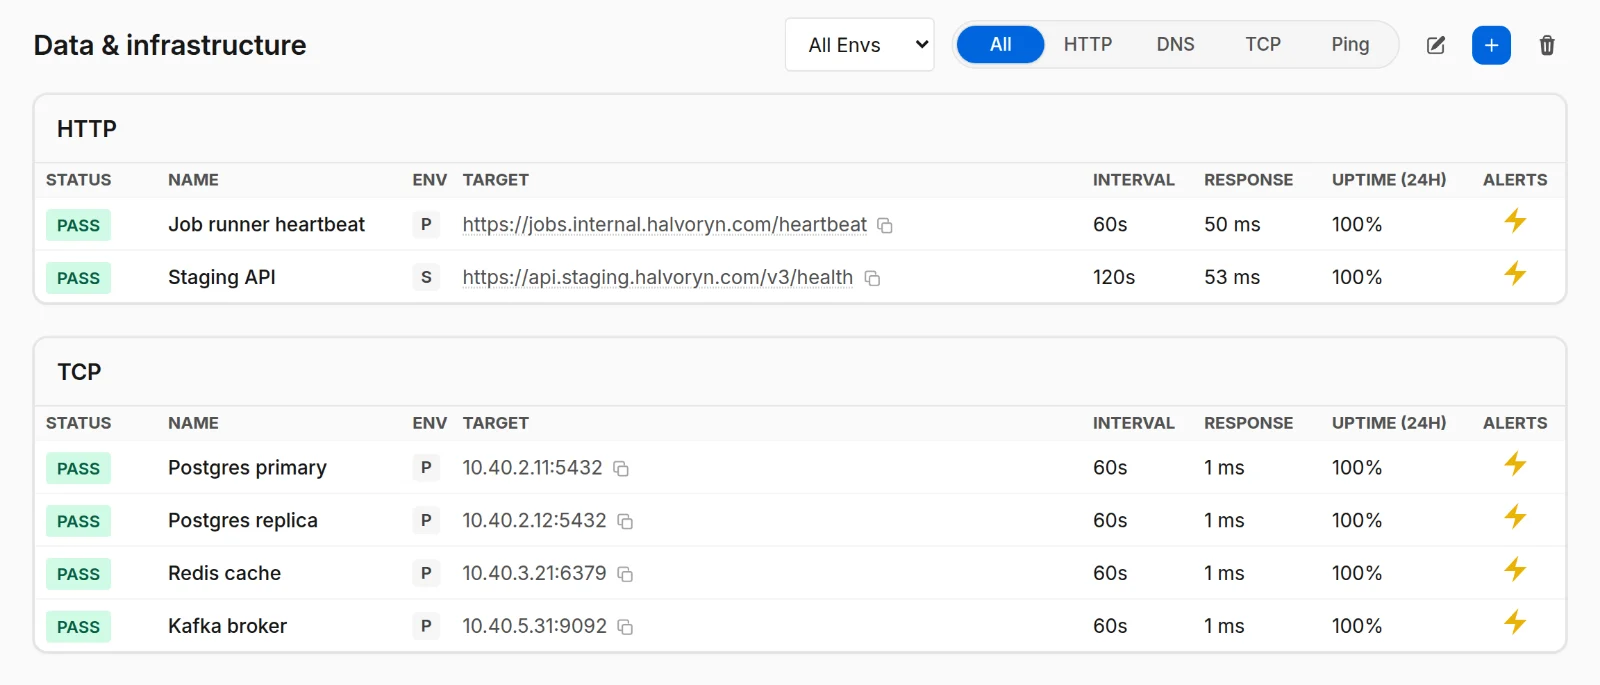
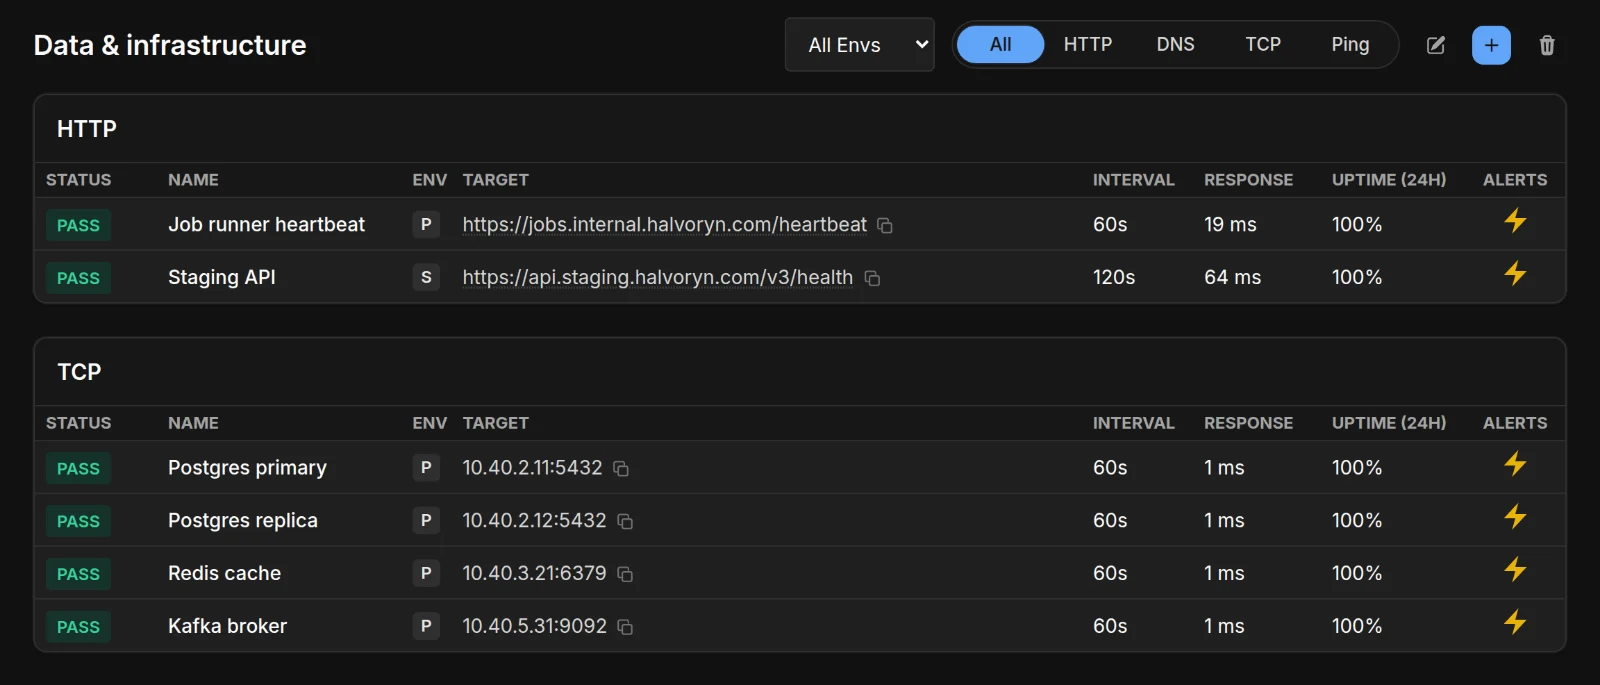
Group checks into projects, see at once which are passing, and jump straight to the one that isn’t.
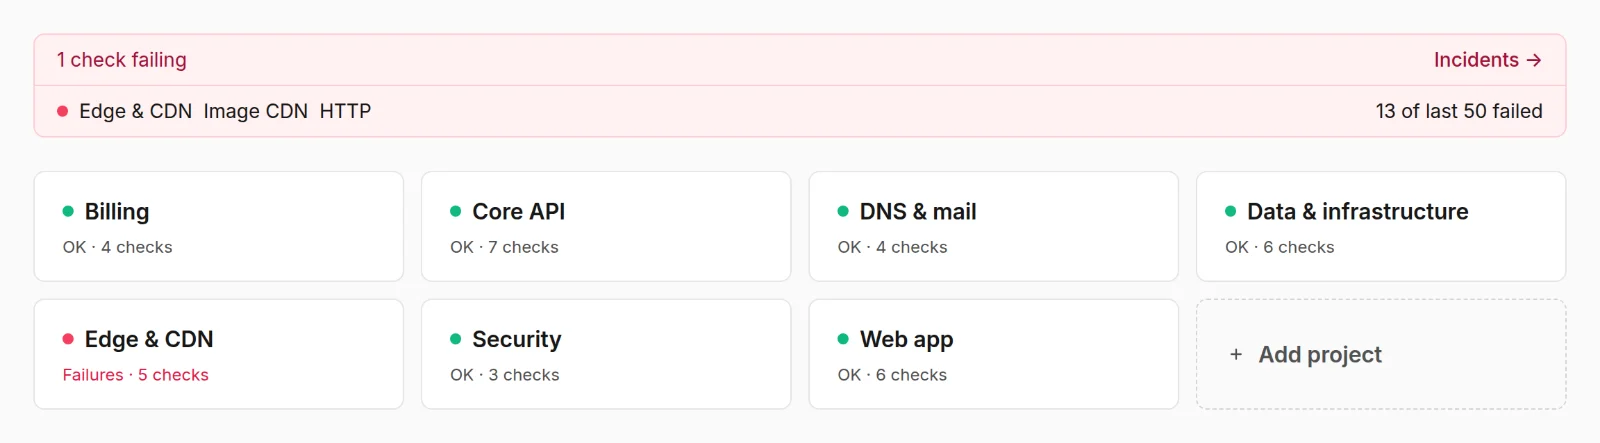
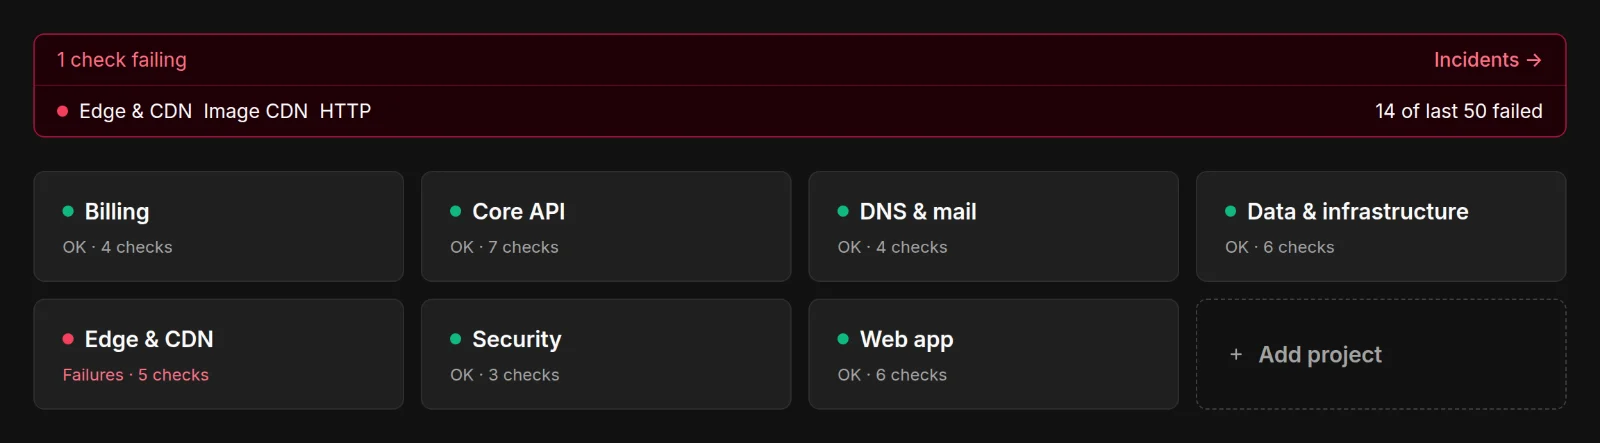


Photo by Taylor Vick on Unsplash
SteadyMonitor checks your websites, APIs and internal systems with HTTP, DNS, TCP and ping checks, from our locations and from inside your own network, and tells your team when something breaks.
SteadyMonitor checks your websites, APIs and internal systems from our locations and from inside your own network, and tells your team when something breaks. These screenshots show a made-up company’s monitoring.
Group checks into projects, see at once which are passing, and jump straight to the one that isn’t.
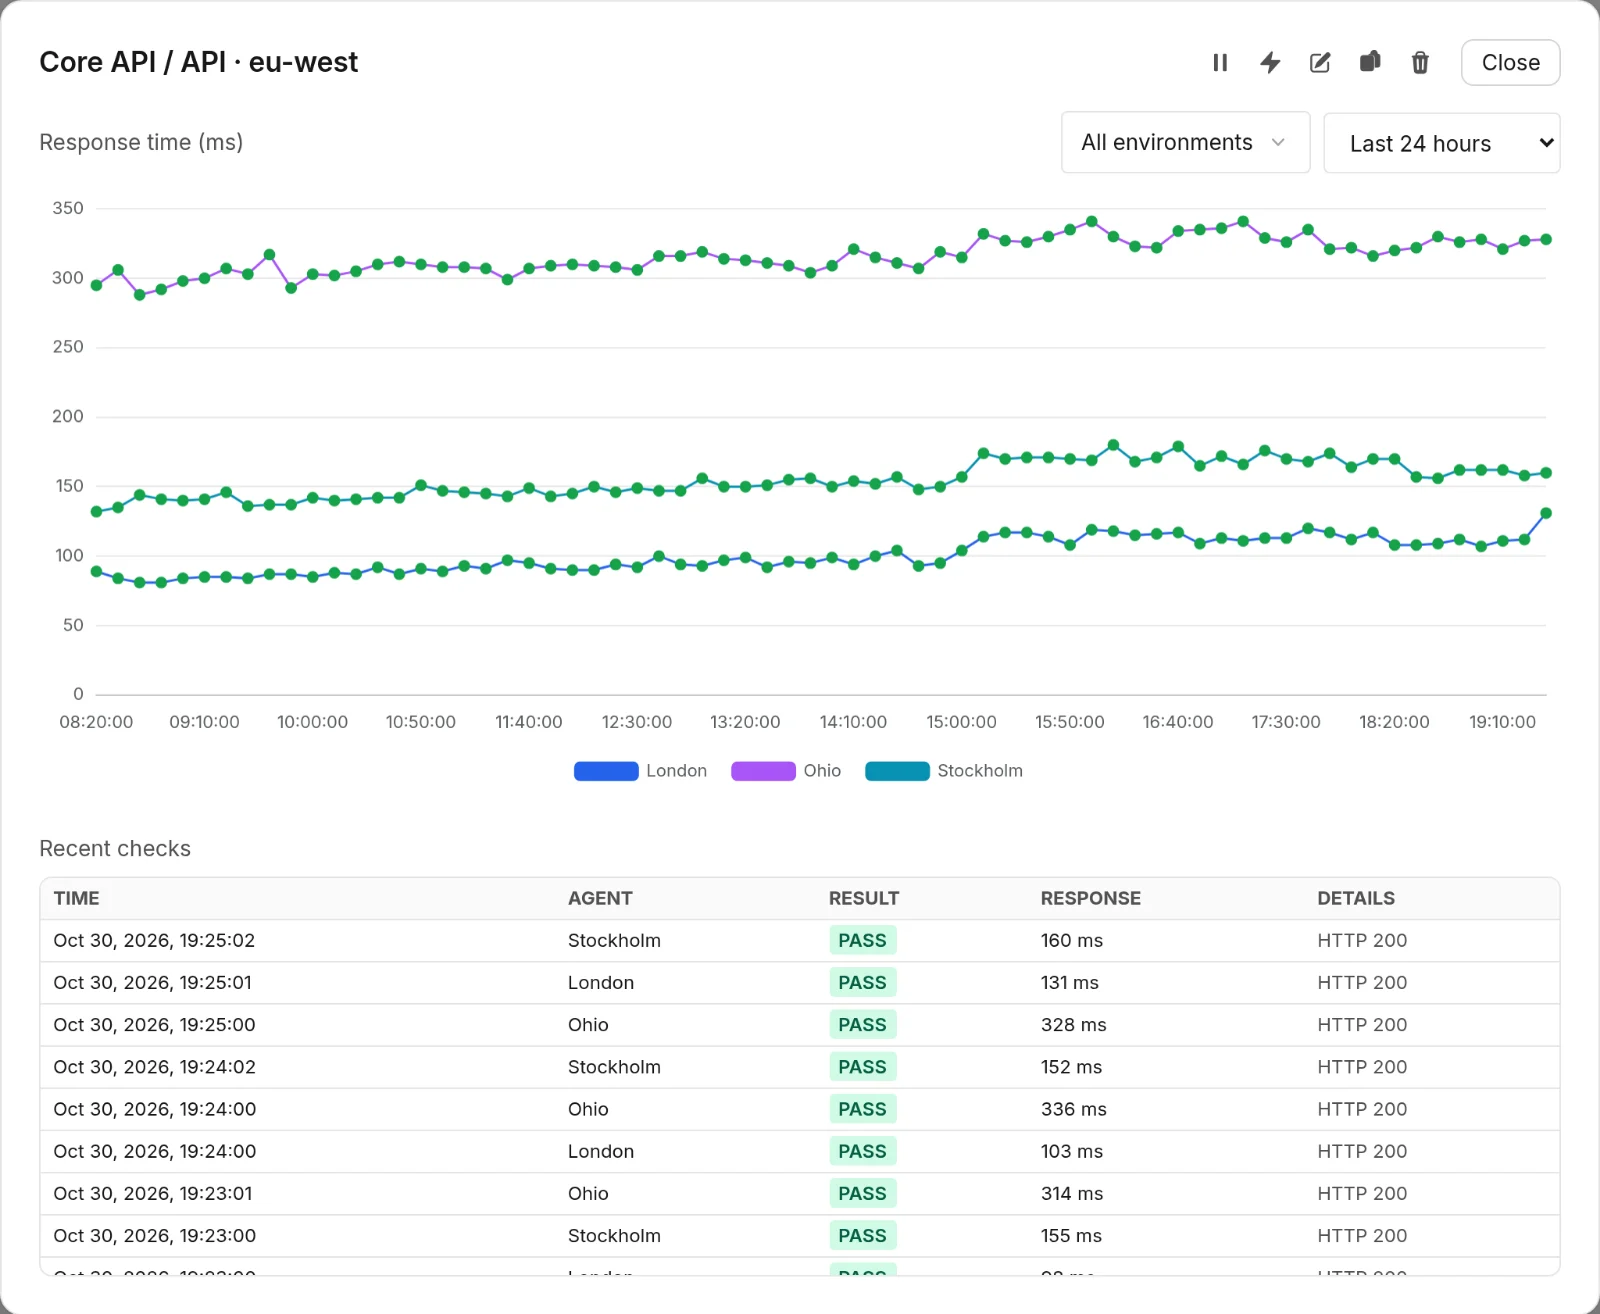
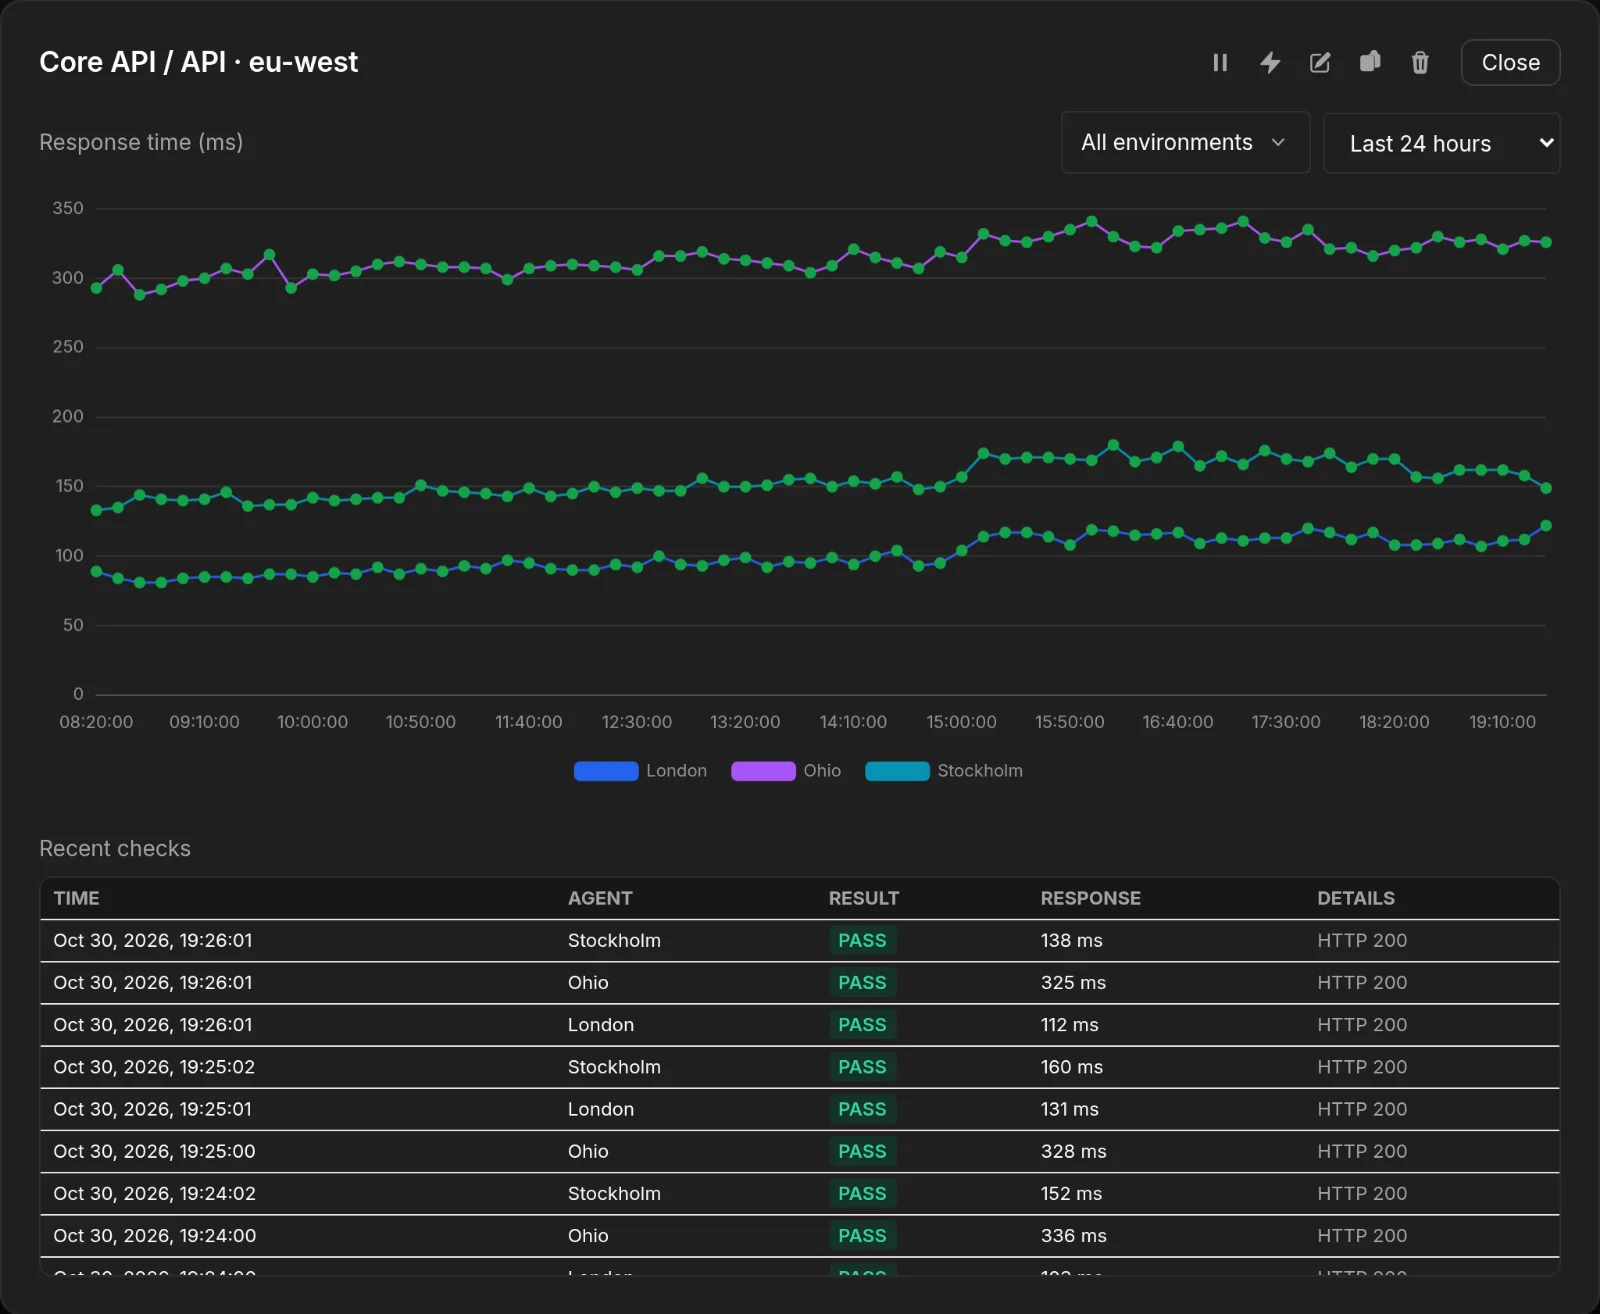
Response time from every location on one chart, over the last hour, day, week or month, with every result kept for 90 days.
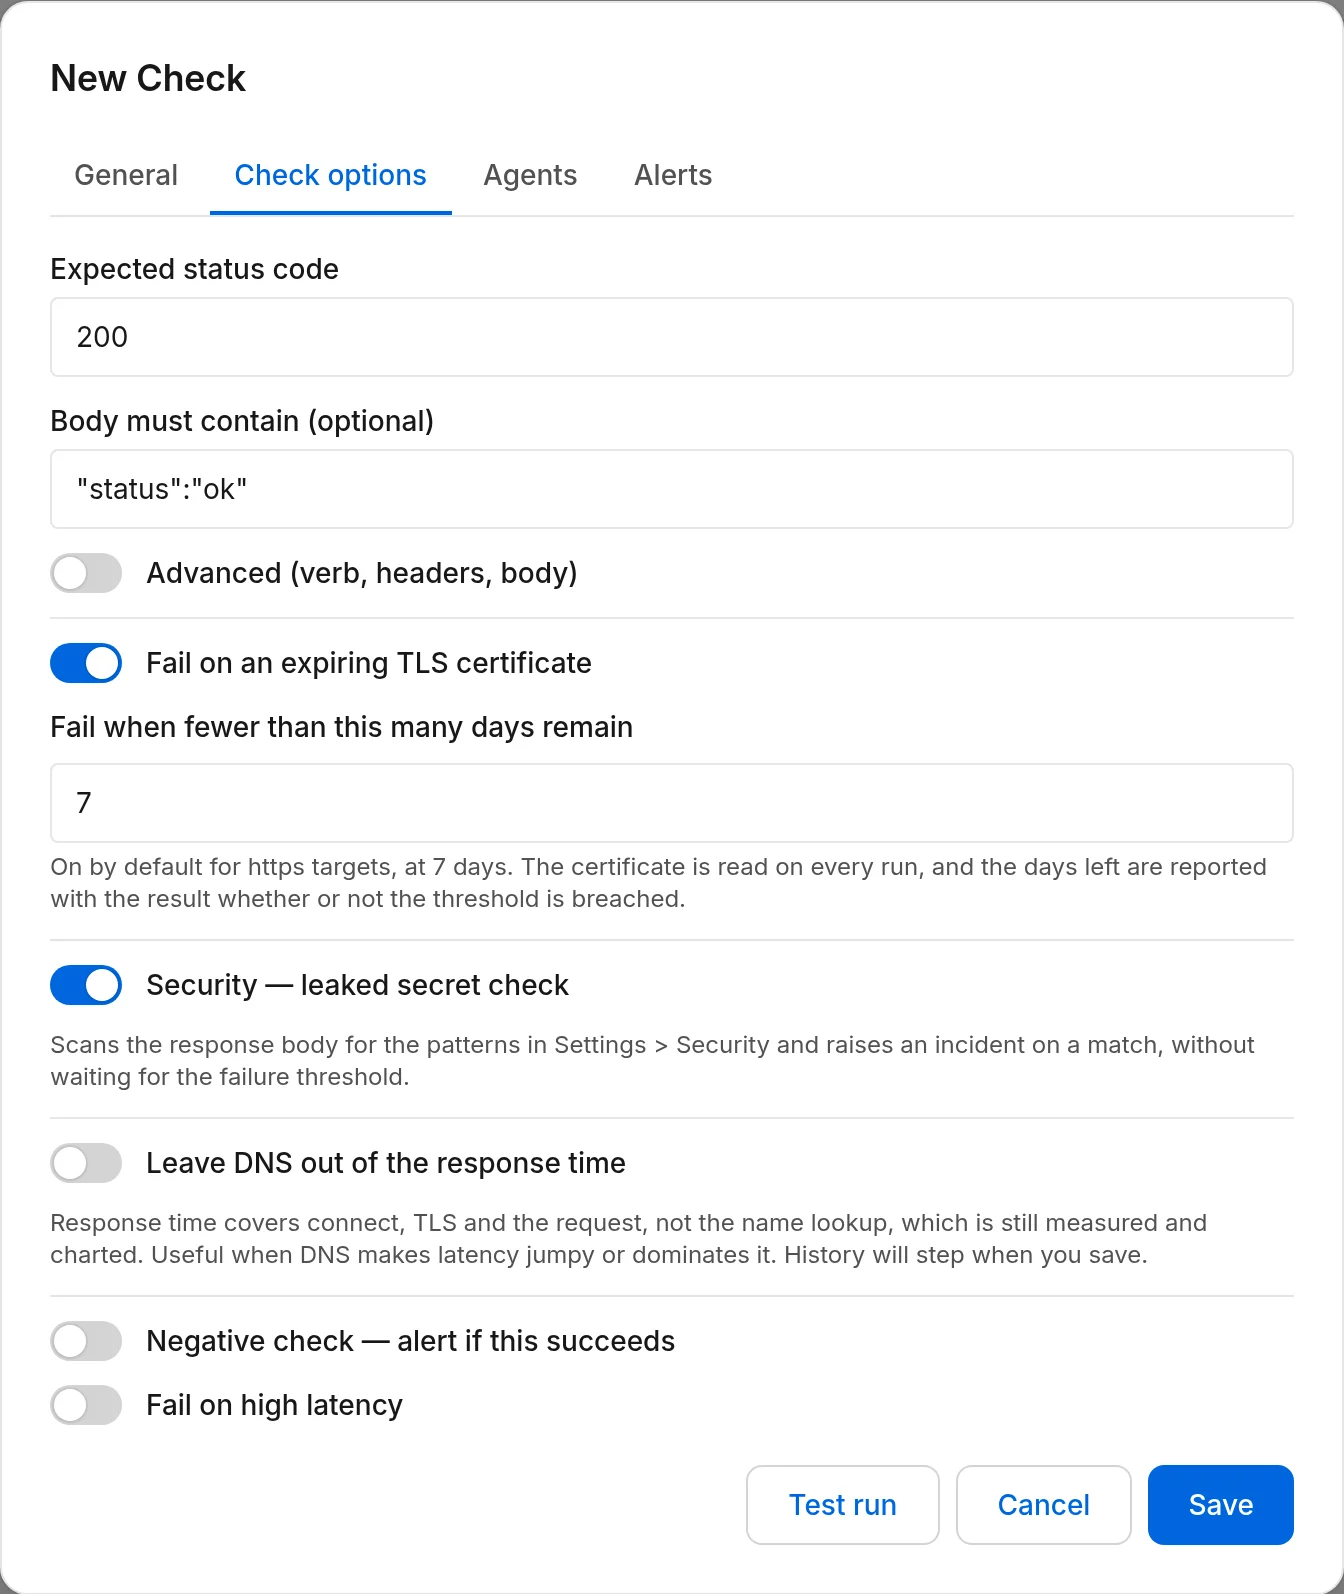
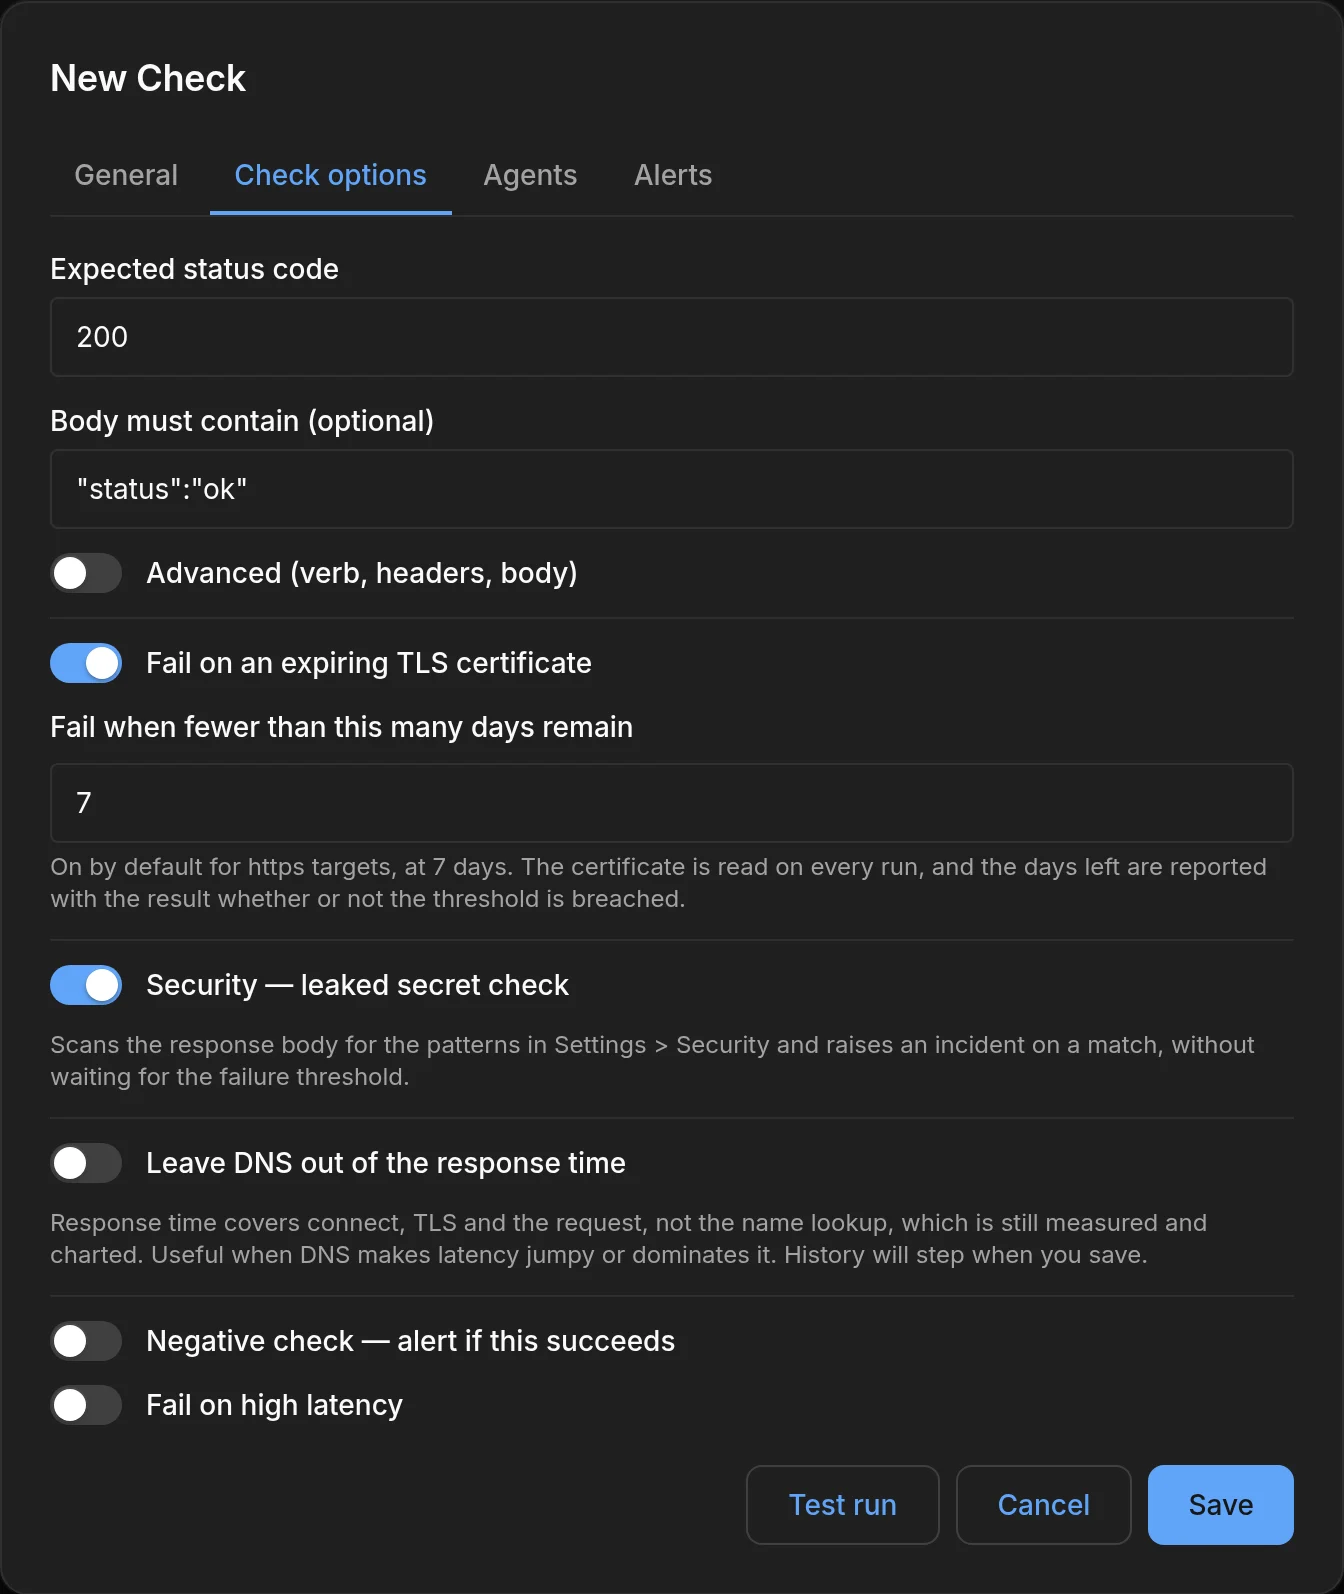
HTTP, DNS, TCP and ping checks, every 15 seconds to every 24 hours. Test status codes, page content and latency, and keep an eye on certificate expiry.
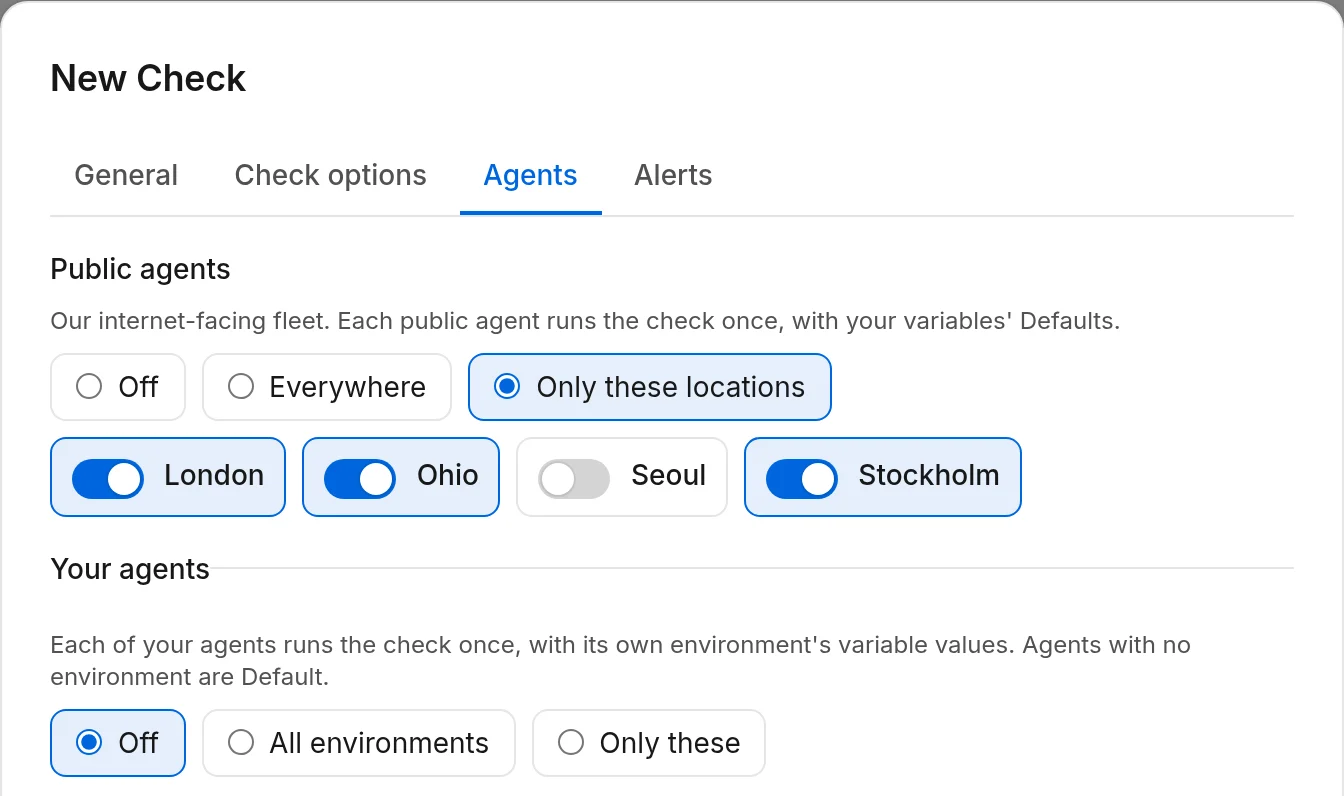
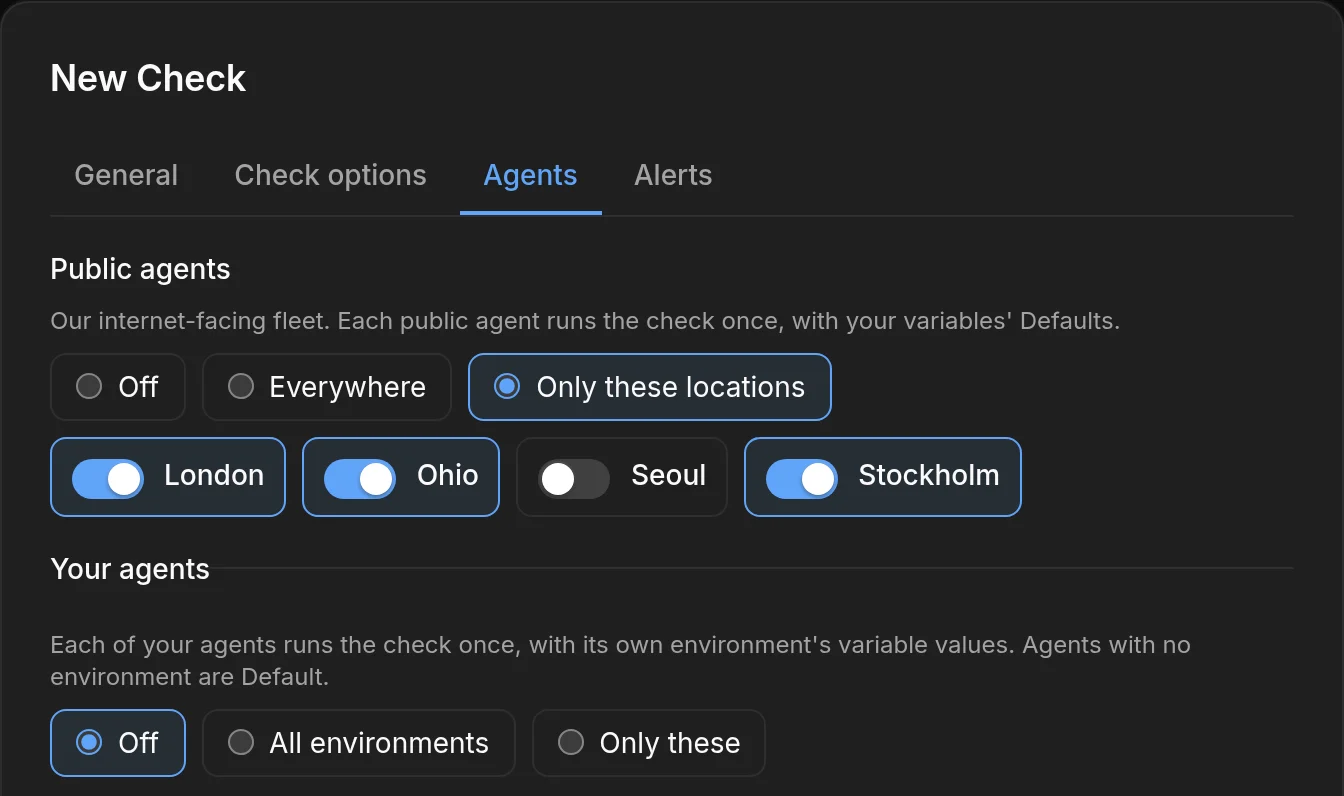
Run checks from London, Stockholm, Ohio and Seoul. Each location is judged on its own, so one slow region doesn’t hide behind three fast ones.
A private agent runs inside your own network and only ever connects outwards, so you can check databases, queues and internal services without opening anything up.
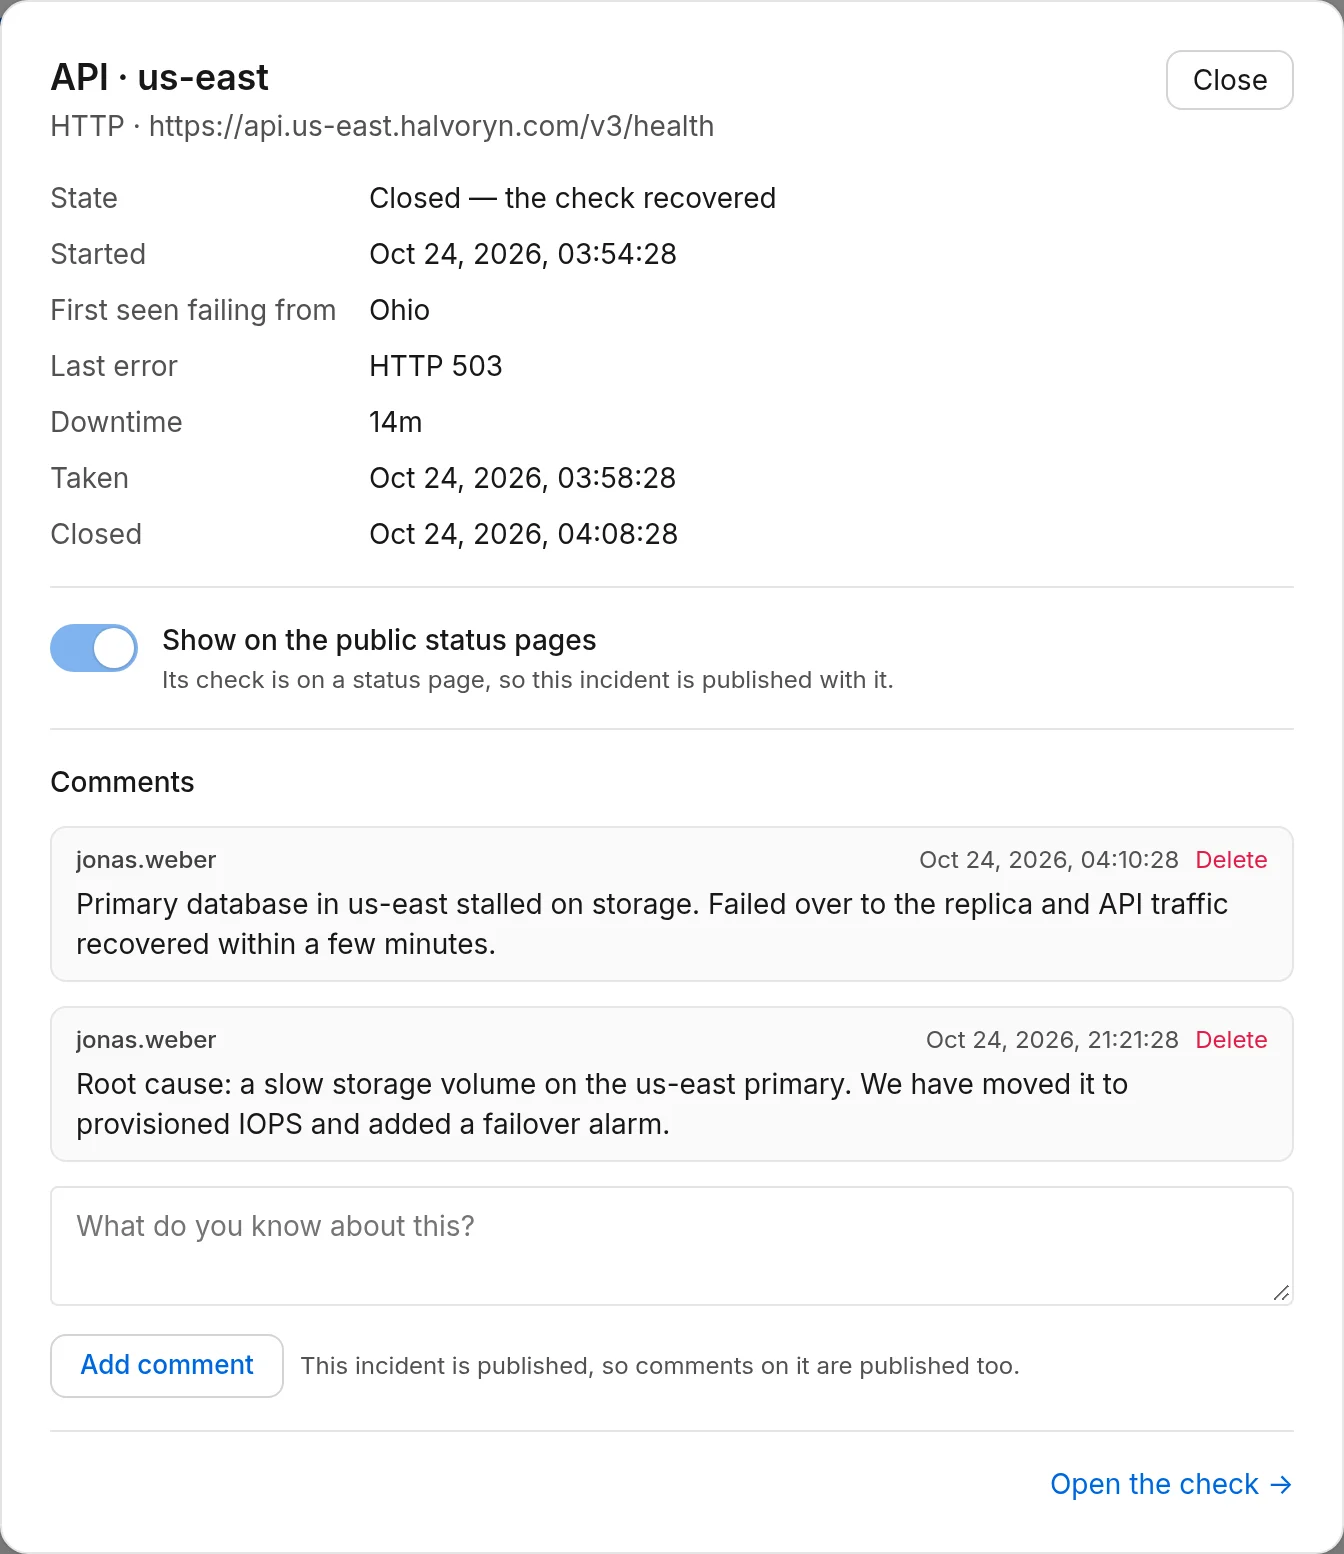
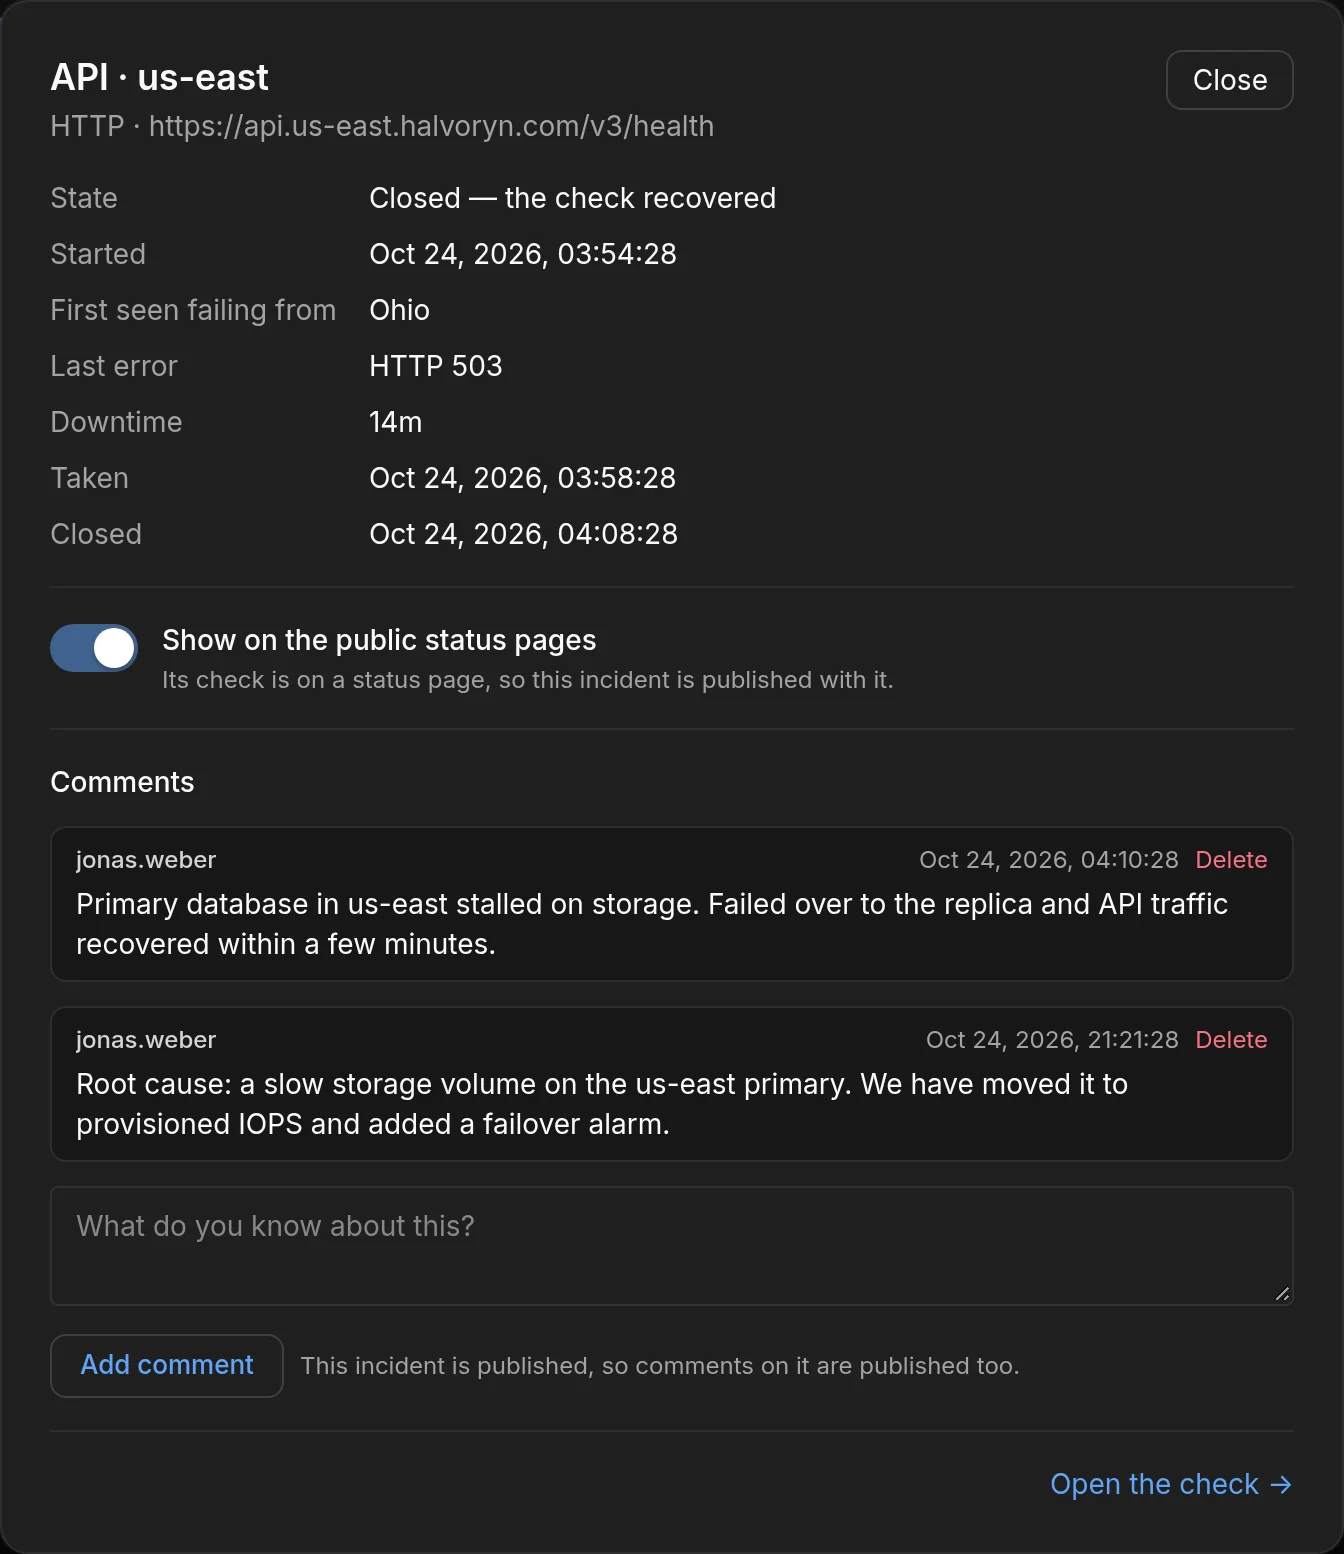
A failing check raises one incident your team can take, explain and close. Taking it stops the repeat alerts, recovery messages are sent automatically, and you can publish it to your status page.
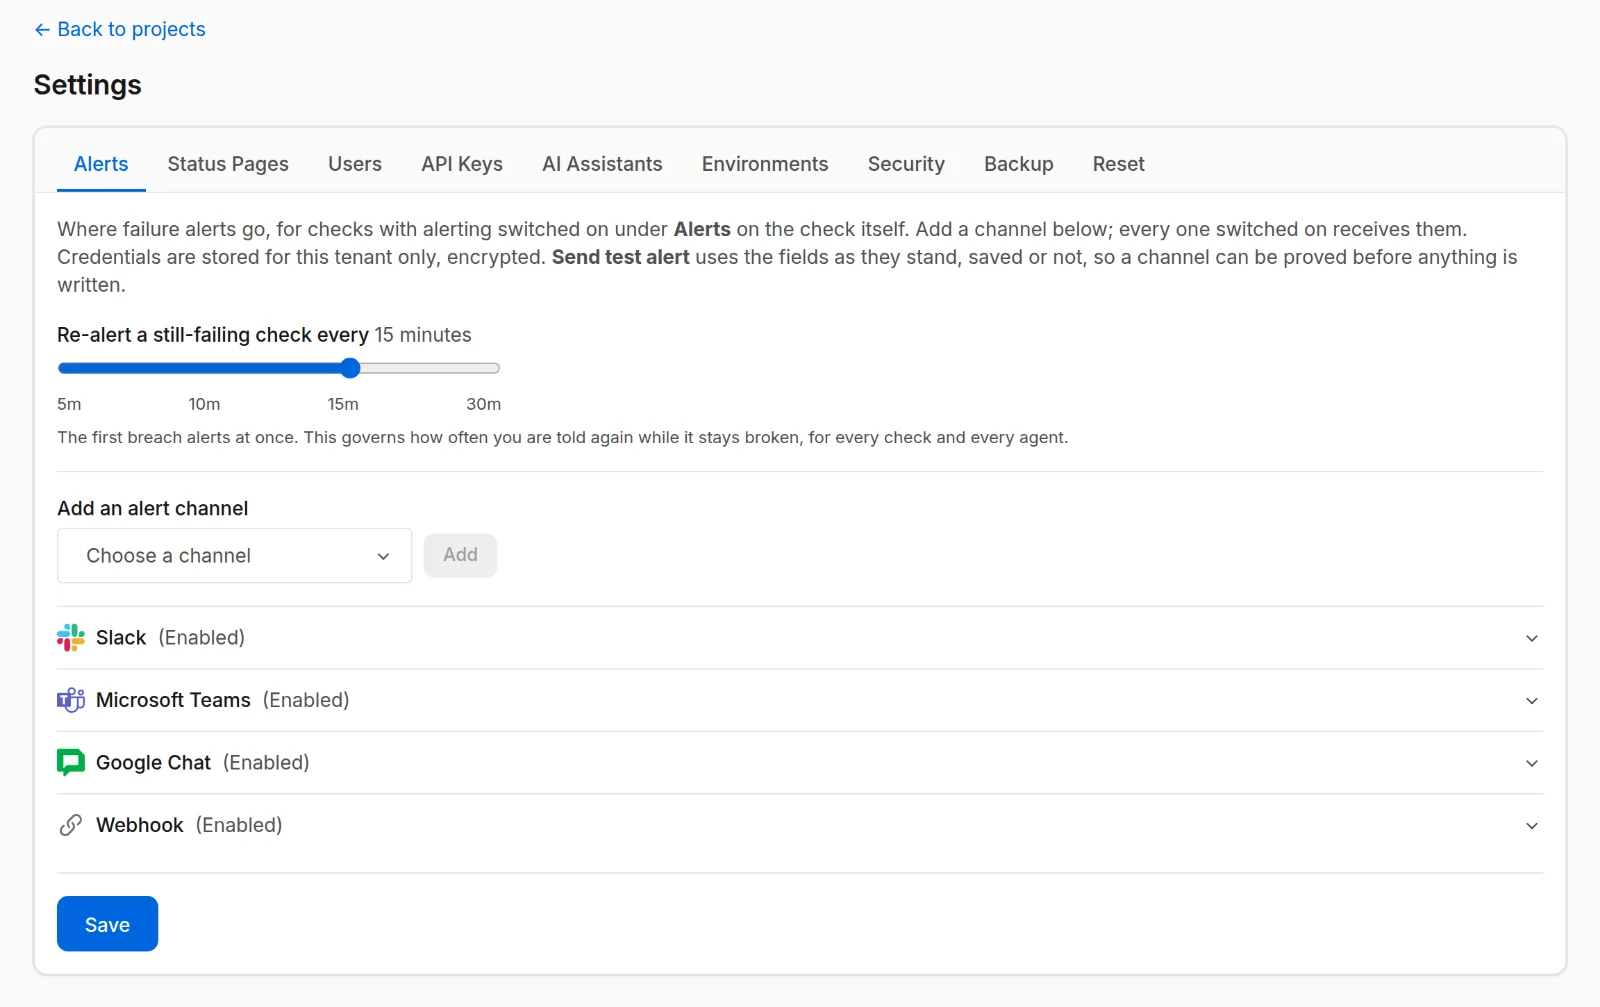
Send alerts to Slack, Microsoft Teams, Google Chat, Discord, Telegram, email, push or a signed webhook, and keep reminding until someone takes the incident.
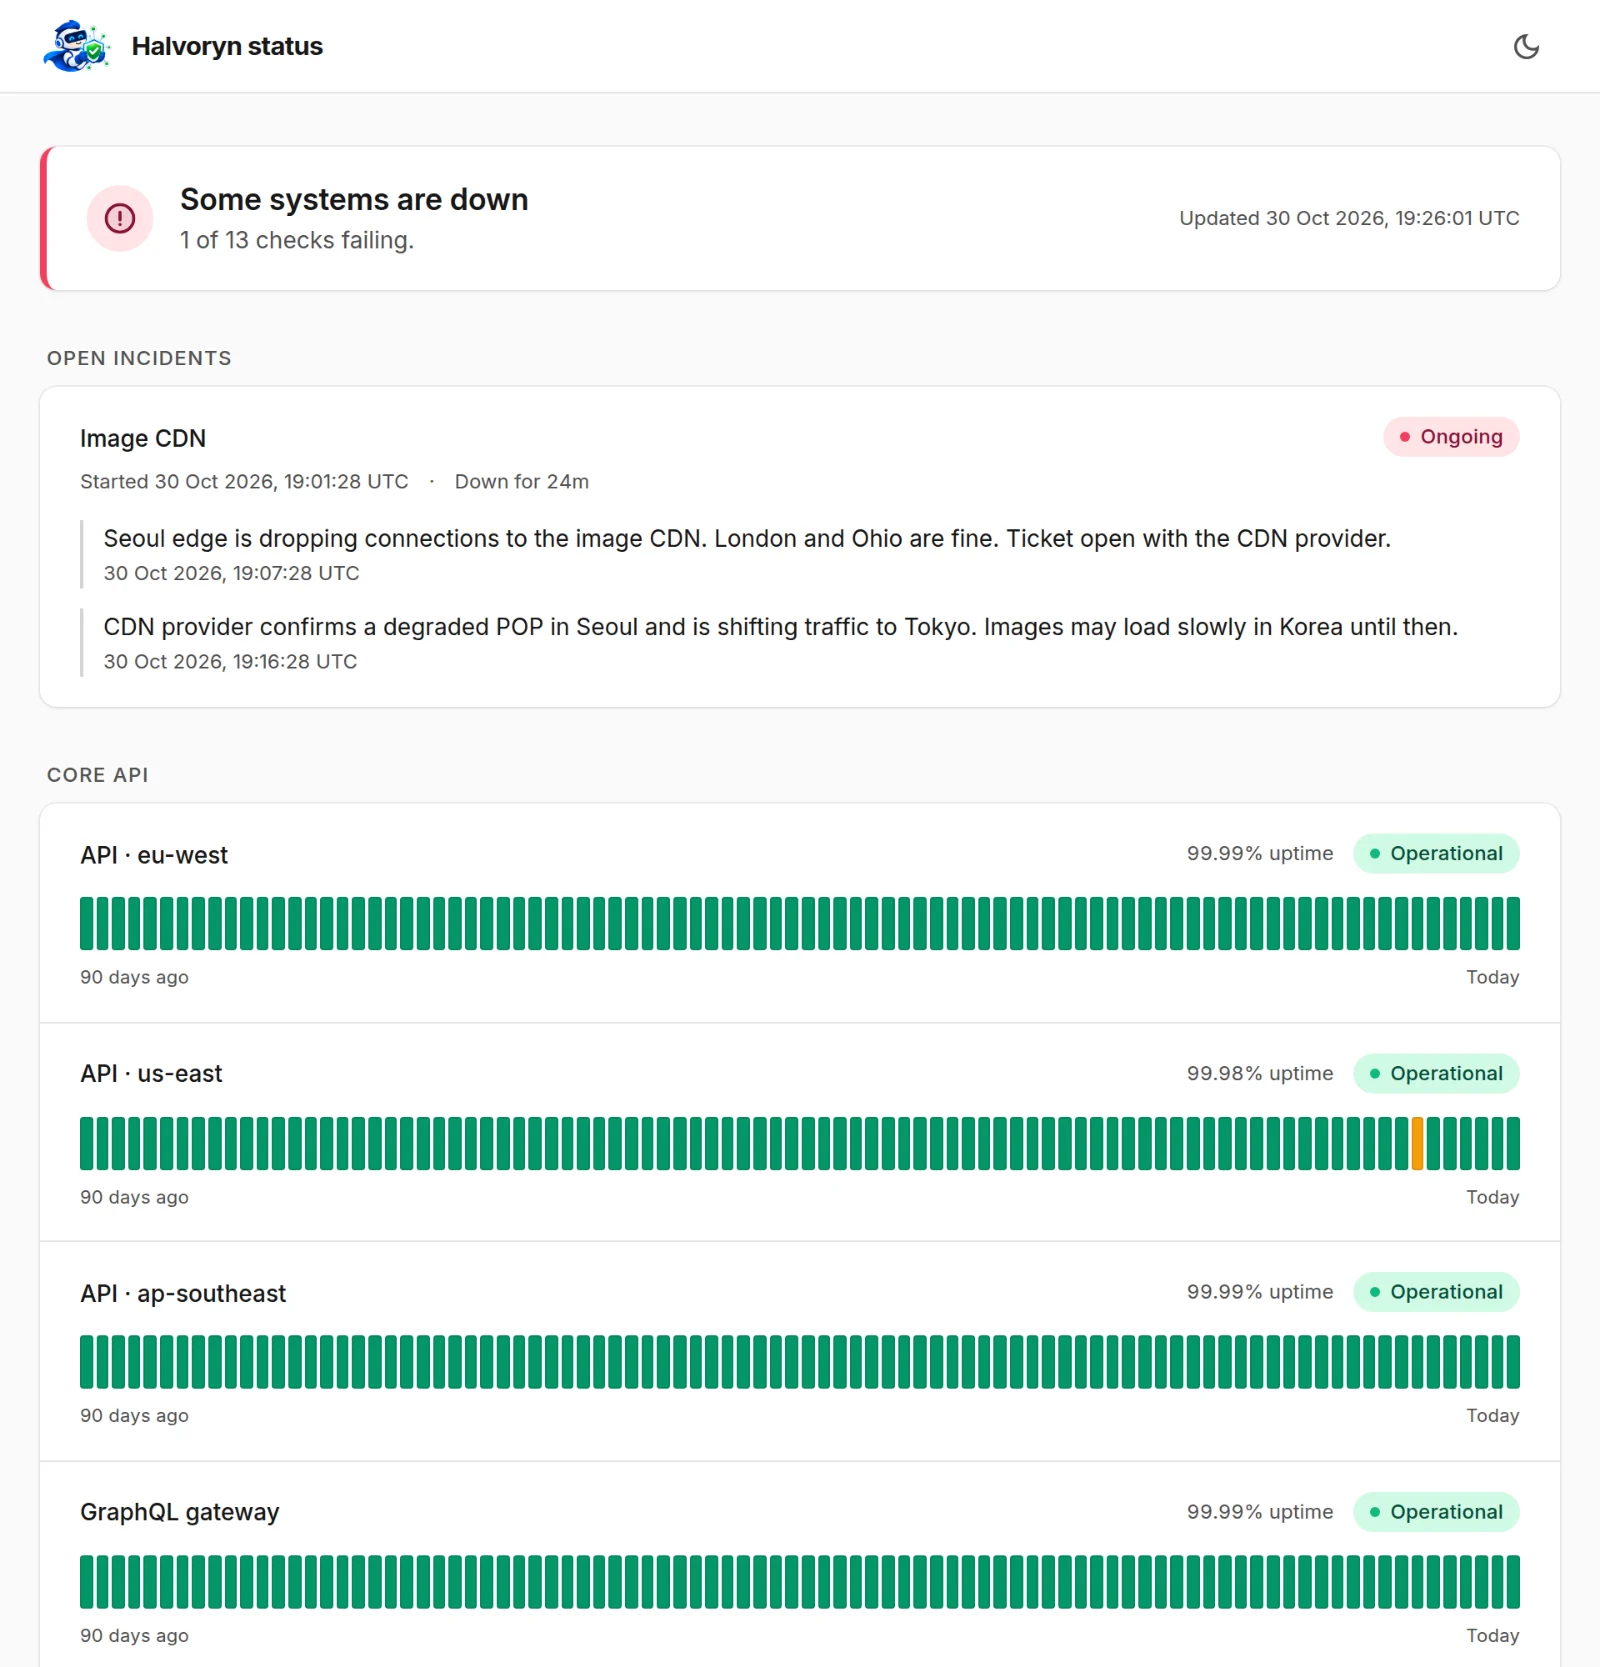
Share status, 90 days of daily uptime and incident updates on a page you control, on your own domain if you like, without exposing your targets or error details.
A small container inside your network that only connects outwards and signs every request. If an agent goes quiet, that raises an incident too.
Write {{HOST}} into a target and run the same check against development, staging and production, each with its own results and incidents.
Decide what counts as down, such as three failures in the last five results, for each location.
HTTP responses are checked for AWS, GitHub, Slack, Stripe and other keys, plus your own patterns. A match raises an incident at once.
Invite as many people as you like, as admins or read-only.
Keys scoped to exactly what they need, read or write, shown once and stored hashed.
A full MCP layer lets Claude, ChatGPT, Gemini or Codex do what the dashboard does, signed in with OAuth: add checks, look into an incident or set up a status page. Anything destructive asks first.
Hosted in Germany, under UK and EU GDPR.
Every feature is on every account, with a free monthly allowance of check runs. If you need more, buy them as you go, with no subscription. See steadymonitor.io for the details.
Yes. Run a private agent inside your network and it checks your internal systems, connecting out to SteadyMonitor so you don’t open anything up.
The checks you choose, their current status, 90 days of daily uptime and your incident updates. It never shows targets or error details.
Bring availability checks together in a clear monitoring workspace. SteadyMonitor checks your services over HTTP, DNS, TCP, and ping, with results and alerts that help you understand when something needs attention.
Interested in SteadyMonitor? Tell us about your workflow, ask a question, or share what you’d like to see.
Get in touch